

Calculate Normal Distribution probabilities online using mean, standard deviation, and CDF. Free Bell Curve calculator for statistics, research, engineering, finance, and education.
Probability Calculator
The Normal Distribution is one of the most important concepts in statistics, probability, data science, finance, engineering, and scientific research. Often referred to as the Gaussian Distribution or the Bell Curve, it describes how data is naturally distributed around an average value. From exam scores and human height to manufacturing quality control and machine learning, the normal distribution plays a critical role in analyzing real-world data.
With the growing popularity of online statistical tools, calculating probabilities under a normal distribution has become easier than ever. A Normal Distribution Calculator allows users to determine cumulative probabilities (CDF), analyze standard deviations, calculate z-scores, and better understand statistical outcomes without performing lengthy manual calculations.
Whether you’re a student learning statistics, a researcher analyzing experimental data, or a professional making data-driven decisions, understanding the normal distribution is an essential skill.
What Is Normal Distribution?
A Normal Distribution is a continuous probability distribution where most observations cluster around the mean (average), while fewer observations appear farther away from the center. When plotted on a graph, the distribution forms a perfectly symmetrical bell-shaped curve.
The highest point of the curve represents the mean, median, and mode, which are all equal in a perfectly normal distribution.
The total probability under the curve is always equal to 1 (or 100%), meaning every possible observation is represented somewhere on the graph.
Key Characteristics of a Normal Distribution
The normal distribution has several defining properties that make it one of the most widely used statistical models.
Symmetrical Shape
The curve is perfectly symmetrical around the mean, meaning values are equally distributed on both sides.
Mean, Median, and Mode Are Equal
Unlike many other distributions, all three measures of central tendency occur at exactly the same point.
Bell-Shaped Curve
The curve rises gradually toward the center and decreases smoothly toward both tails.
Continuous Probability
Every possible value within the distribution has a probability, making it useful for analyzing measurements and continuous variables.
Infinite Tails
Although the curve approaches the horizontal axis, it never completely touches it.
Understanding Mean (μ) and Standard Deviation (σ)
Two important parameters define every normal distribution.
Mean (μ)
The mean represents the center of the distribution.
It indicates the average value of the dataset.
Example:
If exam scores average 75, then:
μ = 75
Standard Deviation (σ)
The standard deviation measures how spread out the data is.
A small standard deviation means data points cluster closely around the mean.
A large standard deviation indicates greater variability.
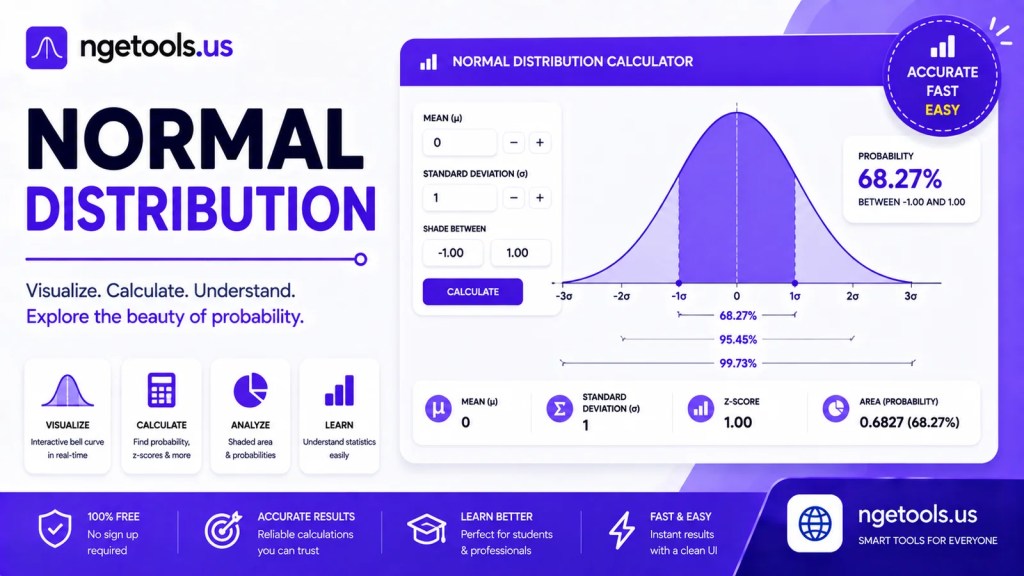
The Empirical Rule (68–95–99.7 Rule)
One of the most useful concepts in normal distribution is the Empirical Rule.
Approximately:
- 68% of data falls within ±1 standard deviation of the mean.
- 95% falls within ±2 standard deviations.
- 99.7% falls within ±3 standard deviations.
For example, if the average test score is 80 with a standard deviation of 10:
- 68% of students score between 70 and 90
- 95% score between 60 and 100
- Nearly all students score between 50 and 110
This rule helps estimate probabilities quickly without performing complex calculations.
What Is the Cumulative Distribution Function (CDF)?
The Cumulative Distribution Function (CDF) calculates the probability that a random variable is less than or equal to a specific value.
Mathematically:
P(X ≤ x)
This is one of the most common calculations performed using a Normal Distribution Calculator.
For example:
- Probability of scoring below 85
- Probability of completing a task within a certain time
- Probability of product dimensions falling below a specified limit
The calculator automatically computes this probability using the mean and standard deviation.
How a Normal Distribution Calculator Works
A Normal Distribution Calculator simplifies statistical analysis by requiring only three inputs:
- Mean (μ)
- Standard Deviation (σ)
- Target value (x)
The calculator then computes:
- Z-score
- Cumulative probability (CDF)
- Probability below a given value
This eliminates manual calculations involving statistical tables.
Real-World Applications of Normal Distribution
The normal distribution appears in nearly every scientific and business discipline.
Education
Schools use normal distributions to analyze:
- Exam scores
- IQ tests
- Student performance
- Standardized assessments
Finance
Financial analysts use normal distribution to study:
- Investment returns
- Portfolio risk
- Market volatility
- Asset performance
Healthcare
Medical researchers analyze:
- Blood pressure
- Body weight
- Cholesterol levels
- Clinical trial results
Manufacturing
Quality control engineers monitor:
- Product dimensions
- Material strength
- Machine precision
- Defect rates
Normal distribution helps manufacturers identify production inconsistencies before products reach customers.
Data Science
Machine learning professionals rely on normal distribution for:
- Data preprocessing
- Statistical modeling
- Feature engineering
- Predictive analytics
Many machine learning algorithms perform better when data follows an approximately normal distribution.
Psychology
Researchers analyze:
- Intelligence tests
- Personality assessments
- Behavioral studies
- Cognitive performance
Benefits of Using an Online Normal Distribution Calculator
Modern online calculators provide numerous advantages.
Fast Calculations
Obtain probability values instantly without consulting statistical tables.
Improved Accuracy
Automated calculations reduce human error.
Beginner-Friendly
Simple input fields make the calculator suitable for students learning statistics.
Cross-Platform Access
Use the calculator on:
- Desktop computers
- Laptops
- Tablets
- Smartphones
No Installation Needed
Everything runs directly in your web browser.
Common Mistakes to Avoid
When using a normal distribution calculator, avoid these common errors.
Incorrect Standard Deviation
The standard deviation must always be greater than zero.
Mixing Units
Ensure all values use the same measurement unit.
Confusing Mean and Median
In a perfect normal distribution they are equal, but in real-world datasets they may differ if the data is not normally distributed.
Using Non-Normal Data
Not every dataset follows a normal distribution. Highly skewed or multimodal data may require different statistical models.
Who Should Use This Tool?
A Normal Distribution Calculator is useful for:
- Students
- Teachers
- University researchers
- Engineers
- Statisticians
- Financial analysts
- Data scientists
- Quality assurance professionals
- Healthcare researchers
- Business analysts
Anyone working with probability or statistical analysis can benefit from this tool.
Frequently Asked Questions
What is a normal distribution?
A normal distribution is a symmetrical probability distribution where most values cluster around the mean, forming a bell-shaped curve.
What is the purpose of a Normal Distribution Calculator?
It calculates cumulative probabilities (CDF), helping users determine the likelihood of observing values below a specified point.
What is the difference between mean and standard deviation?
The mean indicates the center of the data, while the standard deviation measures how spread out the data is around the mean.
What is the 68–95–99.7 rule?
It states that approximately 68% of observations fall within one standard deviation of the mean, 95% within two, and 99.7% within three.
Can I use this calculator for academic research?
Yes. It is suitable for educational purposes, statistical analysis, research projects, engineering calculations, and professional data evaluation.
Does the calculator work on mobile devices?
Yes. The tool is fully responsive and works seamlessly on smartphones, tablets, laptops, and desktop computers.
Conclusion
The Normal Distribution is the foundation of modern statistics and probability theory. Its characteristic bell-shaped curve helps researchers, educators, engineers, financial professionals, and data scientists understand how values are distributed around an average. By using a reliable Normal Distribution Calculator, you can quickly compute cumulative probabilities (CDF), analyze datasets, and interpret statistical results with confidence.
Whether you’re studying probability for the first time, conducting academic research, evaluating manufacturing quality, or building predictive models, this online calculator provides a fast, accurate, and user-friendly solution. With support for mean, standard deviation, and cumulative probability calculations, it transforms complex statistical concepts into practical insights that are easy to understand and apply.